 LOADING...
In this article, we’ll explore JavaScript code debugging techniques and their impact on integrating development processes and reducing errors.
Debugging is all about finding the problem, fixing the bugs, and making sure your code works smoothly.
When you debug, you can improve the quality and performance of your software. You can also make your code more reliable and secure for production.
Let’s see how it works!
1. Browser Dev Tool
In today’s browser development tools, there are many optimized sources to debug and test your code. These tools provide various utilities for different types of debugging.
Elements: Edit HTML and CSS (Live DOM editing without changing the main code).
Network: Test API requests or network activity.
Console: Log information in JavaScript using console.log().
Performance: Check and monitor the performance of each web page.
Sources: Check page visibility (how the page is visible publicly) to avoid unnecessary information from being public.
Almost every modern browser has this feature to debug and test your code and performance effectively.
2. Applying BreakPoints
For debugging JS code, breakpoints are a powerful tool to check code execution step by step.
Here’s how to debug your code:
1. Add debugger; at the end of your check points area.
2. Open the browser inspector tool.
3. Refresh the page.
function validateUser(user) {
  if (!user.name) {
    console.error("User name is missing!");
    debugger; // Add debugger here to pause execution for inspection
  }

  if (!user.email) {
    console.error("User email is missing!");
    debugger; // Add debugger at the end of your checkpoints area
  }

  console.log("User validation completed.");
}

const userData = { name: "John" };
validateUser(userData);
Now, you can hover over any variable to see its upcoming value.
Code execution will pause at the point where you add debugger;, its helps developers track complex Data related issues in DOM easily.
Benefits:
1. - No need to apply console.log() in every step to check data values.
2. - Get an exact issue quickly.
3. - Save time in development.
3. Console Debugging
It’s another powerful technique to debug code and check Data values from APIs or function results.
In JS, we can apply console.log() to check Data values.
1. It also shows errors in programs, such as missing scripts or special errors while working with frameworks like React.js.
2. Essential errors to resolve and optimize performance for production.
Not only checking values but also helps check the program’s process, for example.
async function XYZ(){
    console.log(‘execution start’);
    await newFun();
    console.log(‘execution end’);
}
XYZ();
Analyze the function’s process. First, console.log() executes when the function is called. Then, newFun() starts running after its response. Finally, console.log() triggers, revealing the process’s completion.
Console debugging is used in browsers and almost every server-side programming language like Node.js, Python, and Java.
Libraries for Console Debugging:
- Node.js: Winston, Pino, Bunyan
These libraries help save development time by reducing mistakes in complex projects.
In addition to console.log(), JavaScript also has console.warn() and console.error(), which perform the same function but have different aesthetics or highlight warnings and errors for displaying console messages.
4. Remote Debugging
Remote debugging enables debugging applications running on different machines or environments from the debugger. It can involve debugging a server-side application in a different location or a web app in a mobile browser.
This debugging is crucial before deploying the application to the production environment, as it shows how the application and logic work on different locations, devices, or browsers.
For web apps, the browser developer tools (casually the browser console) can be used to check Visual, activities, errors, and performance. Even for other devices like mobile tablets and large screens.
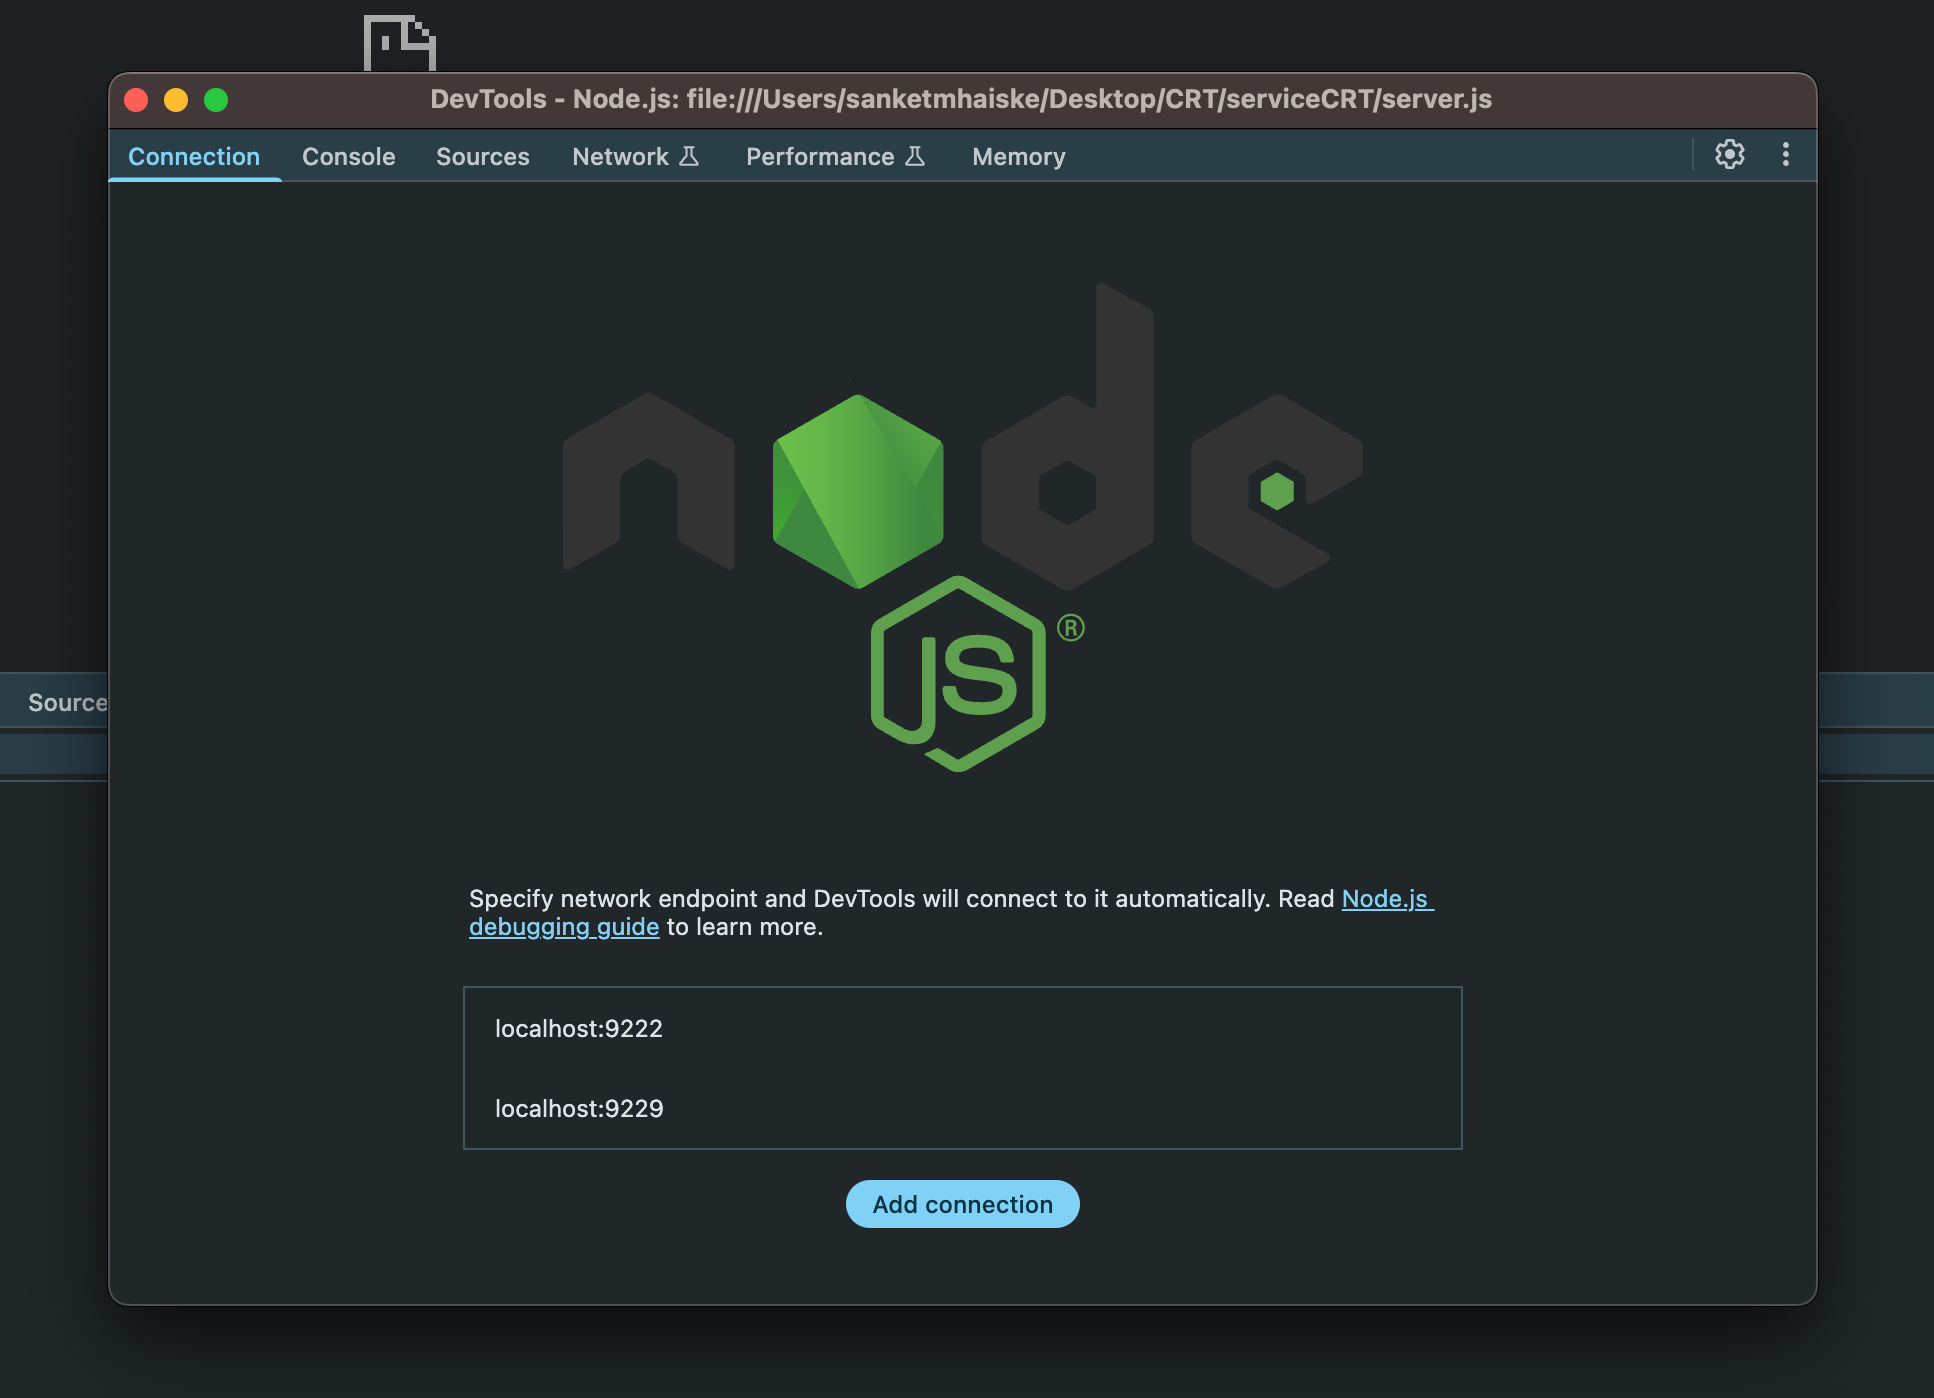
For Node.js, a special development tool is provided for the server. To access it, run the command node —inspect server.js from the terminal. This will create a separate browser development tool for the server.
Once you run this command, you’ll get the message below.
The debugger listens on
ws://127.0.0.1:9229/8871f933-35bd-4abe-850c-62604c4eb0a1.
In the browser, open the URL ws://127.0.0.1:9229/8871f933-35bd-4abe-850c-62604c4eb0a1.
On this URL you will get nothing. Just open browser inspector tool.
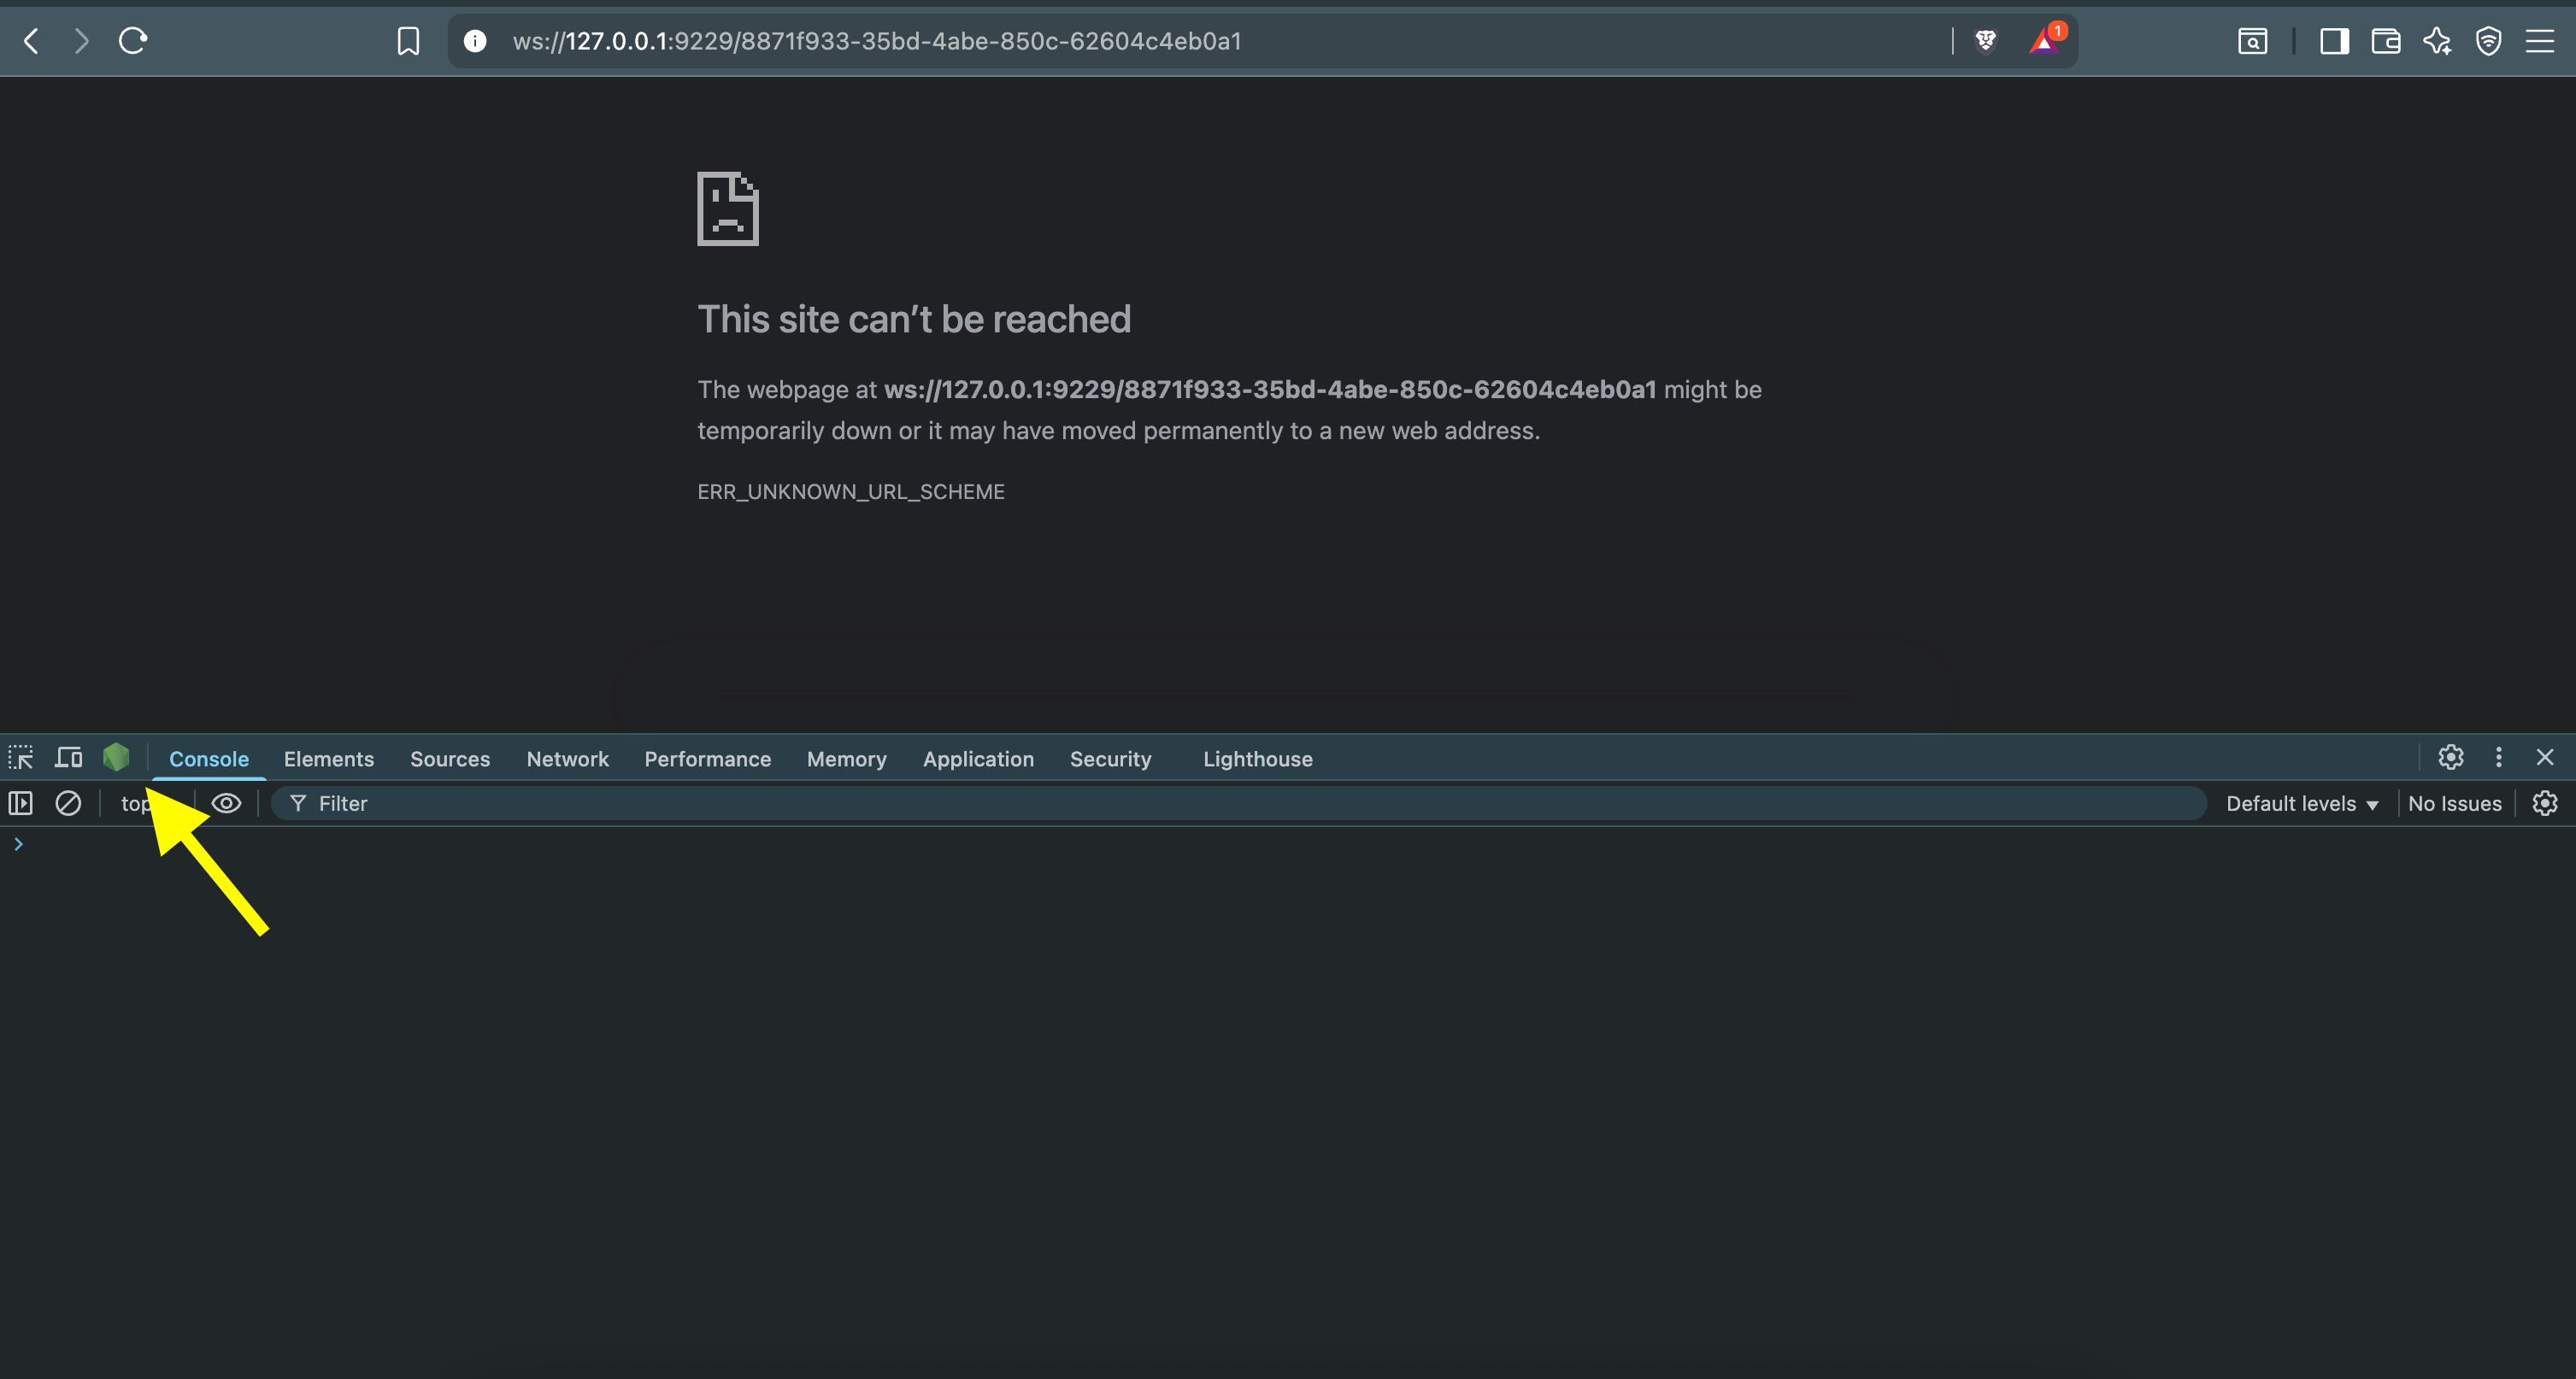
Click on the Node.js icon to open a new Node.js terminal for debugging and testing the server code.
5. Common issue with JS
JavaScript is a forgiving language that allows you to write code without detecting or predicting errors. It runs the code and throws errors if any. However, dealing with complex data can be challenging. TypeScript offers great features for writing code with fewer or no mistakes. It’s not limited to types and predicts errors instantly while processing the code, making it ideal for writing clean and errorless code.
If you want cleaner, more reliable code, switching to TypeScript can dramatically reduce debugging time.
Now, it’s your turn to give it a try! Experiment with these techniques in your project and let us know what you think in the comments below. Thanks for reading this article!